The Dashboard Charts and Table views are included in the Free Plan. You will need to have at least one organization under a premium plan to see the Issue Log.
This article covers help with:
How-To Video
CHARTS
Start with selecting the Organization at the top of the page for your charts if you are part of more than one organization.
You will see chart data on the projects you belong to.
To reorder the charts, drag a chart left or right using the three-bar icon in the upper right of the chart panel.
You can use the Filters button in the upper right of the Dashboard page to filter down your Charts to a workspace, workspace tag, or project tag.
Project Progress chart displays the first five projects alphabetically from your Project List page. However, you can define which projects to display in this chart from the Table view (see Table section below).
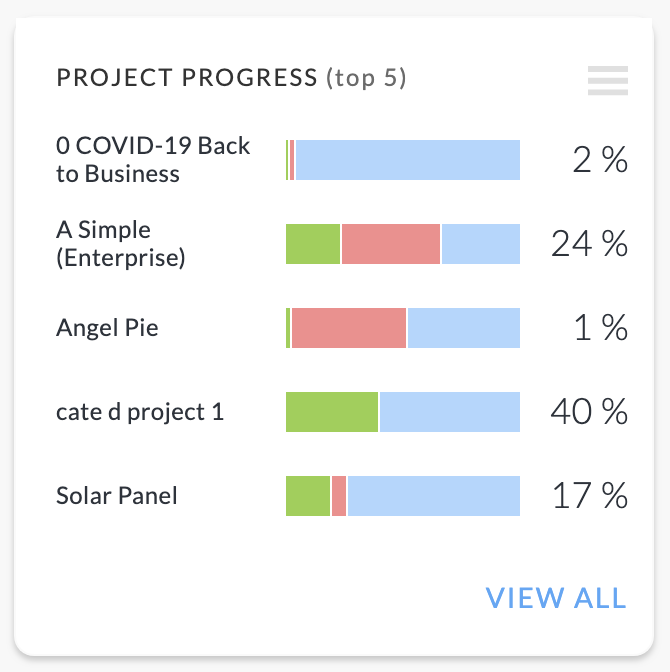
Hover over the bar colors to get popup numbers for each color. Blue represents Not Started tasks. Red represents Late tasks. And Green represents Done tasks.
When you have selected the Top 5 buttons in the Table (see below), the list in this chart will change from the first five projects in your Project List page to the selected Top 5 projects. (See below for how Top 5 works).
All Issues & Risks chart displays any open and closed issues and risks. If you projects don't have any issues or risks, then the chart will "No Issues" with a background generic image. To learn about issues and risks, check out the about posts article.
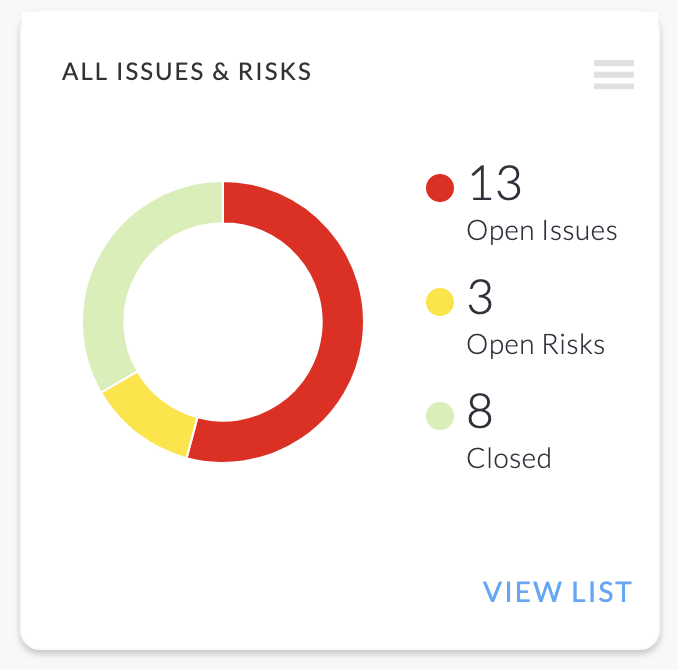
You can hover over the chart's donut ring to get more information.
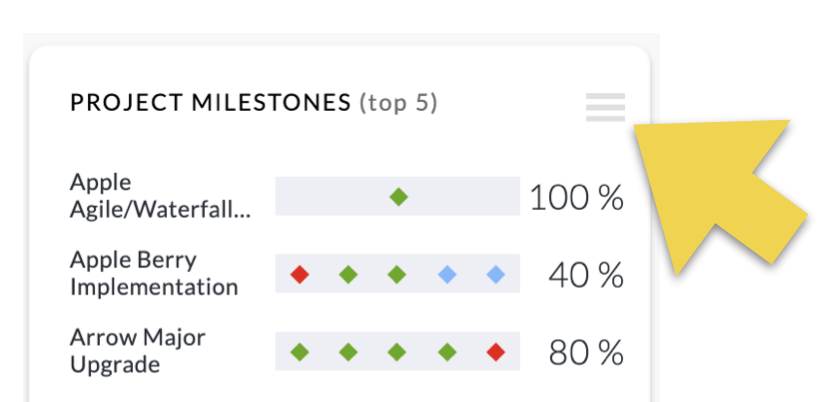
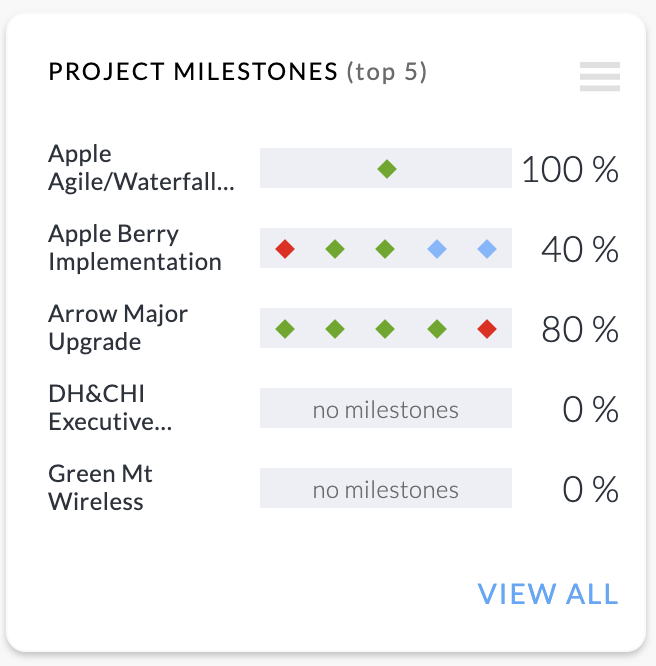
Project Milestones chart displays the
This chart displays your Top 5 project's milestones, assuming you have set up milestones in the project. You can hover over the diamonds to get more information. Red diamond means the milestone is late, green represents done, and blue is for milestones due in the future.
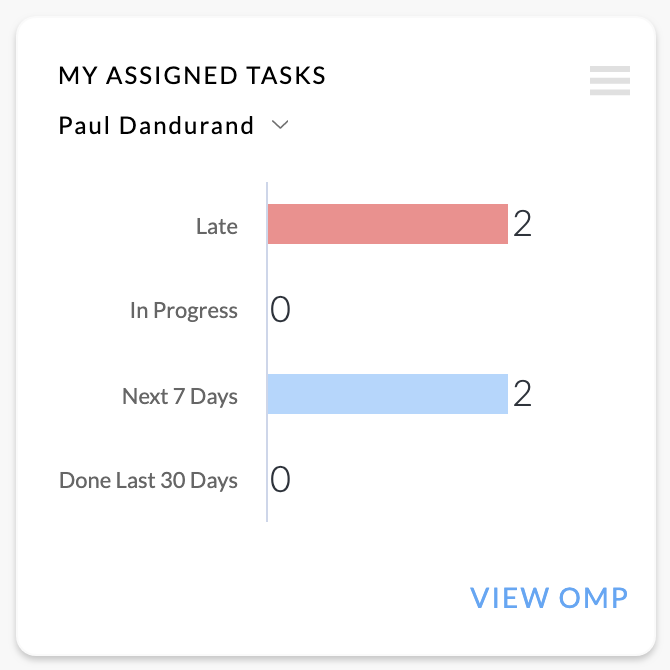
My Assigned Tasks chart displays the the logged in your own personal task count for the organization set (and any workspace filtering if the filter is set). Clicking the VIEW OMP button will bring you to your OMP page. Secondly, if you are a Project Admin on some projects, you can switch your chart to another team member's chart who's in your project. To do this, click your name to get the search field and then type in that member's name and select to show their chart. If you click their VIEW OMP button, it will take you to the On My Team's Plate view with that person filtered to show their tasks.
Watch the How-To video above to see Charts in action.
TABLE
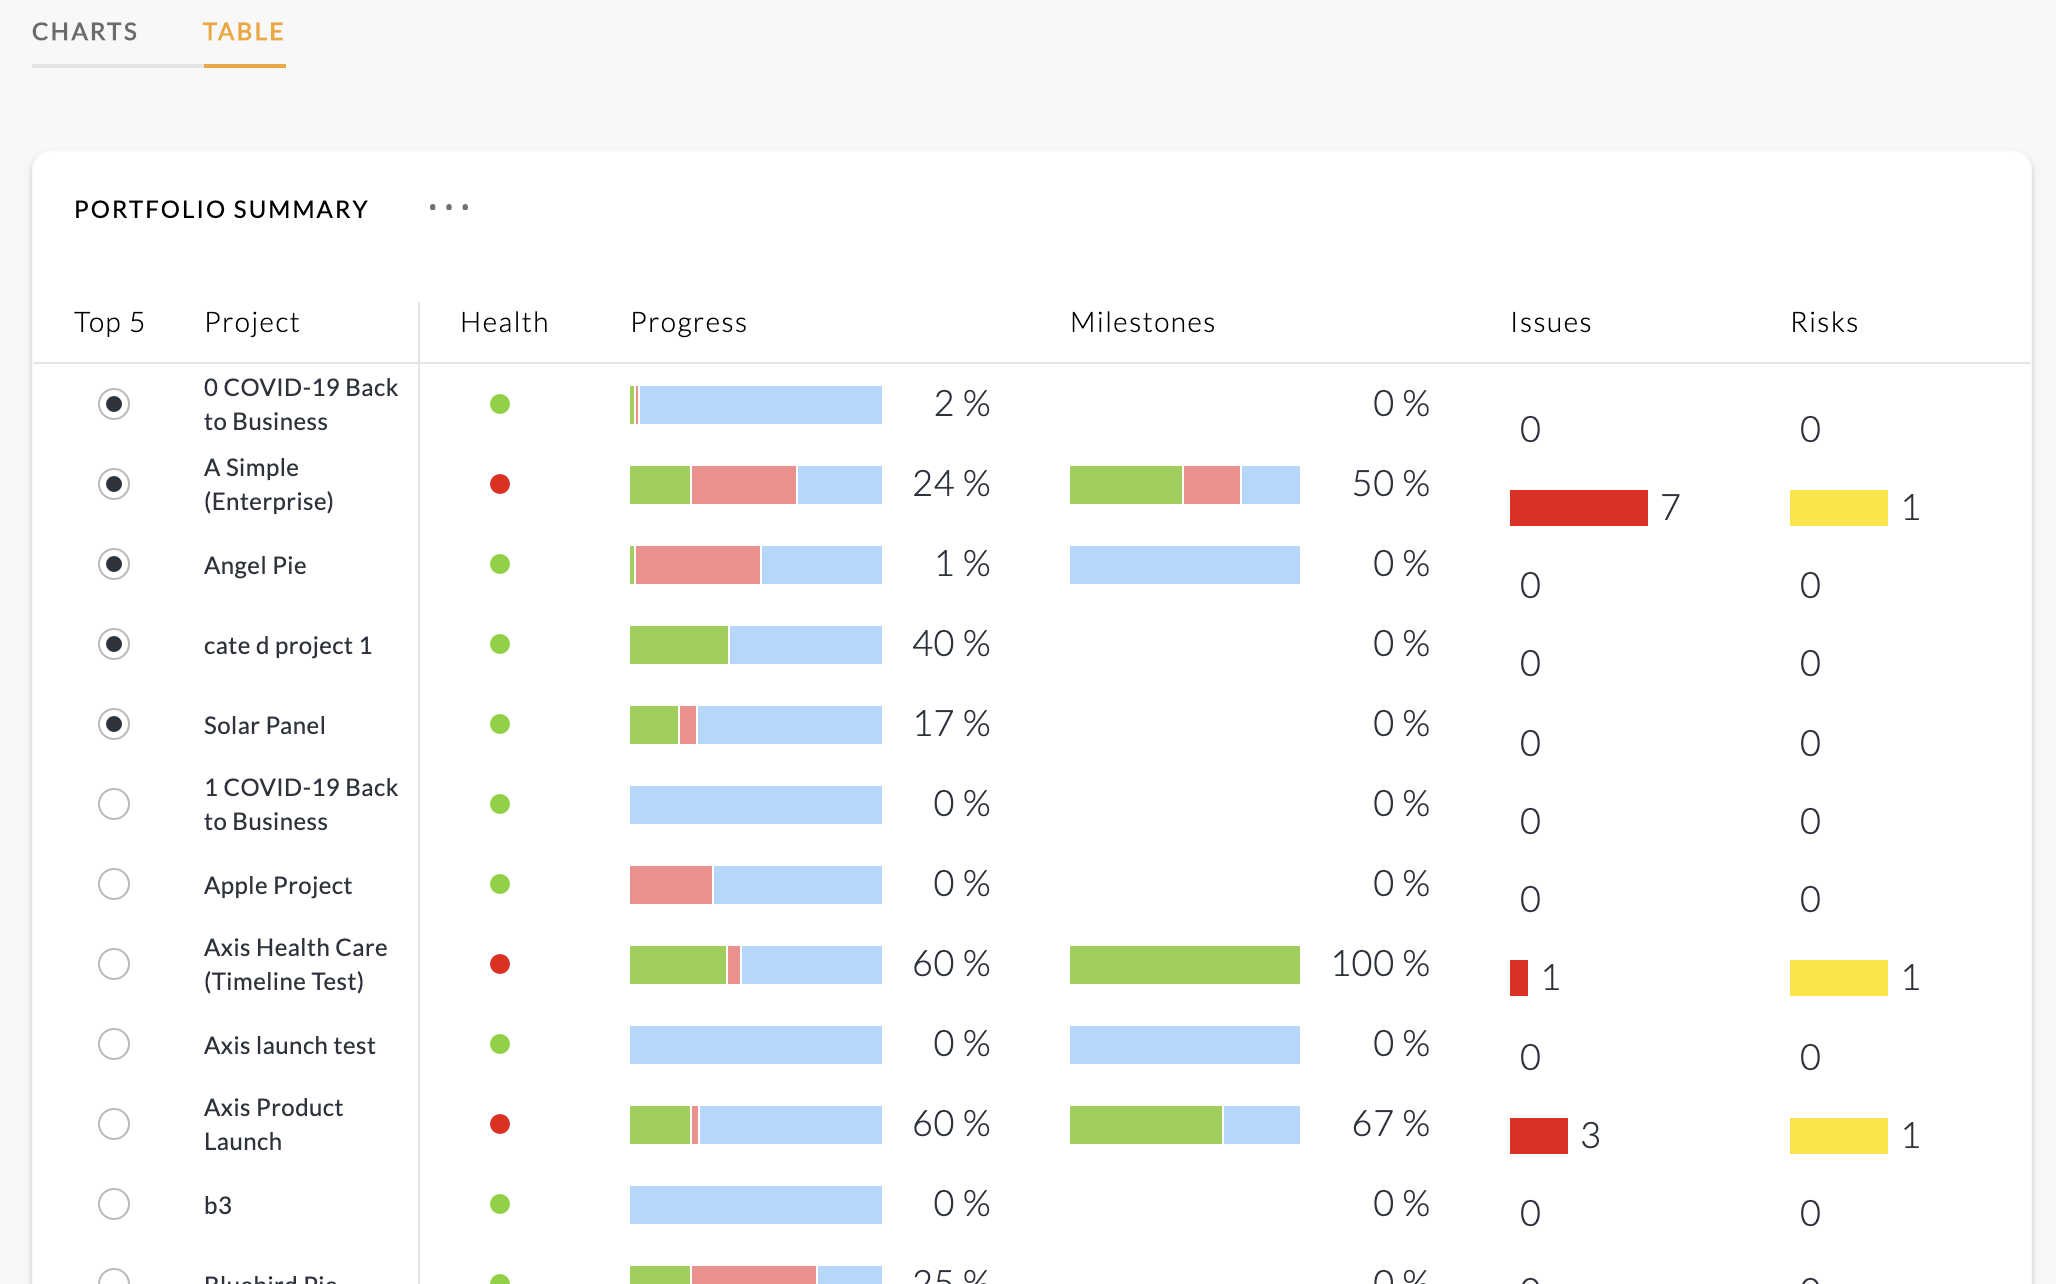
Click the TABLE tab or click the VIEW ALL button in the Project Progress chart panel to see the Table page. This view displays all projects you belong to.
Similarly to Charts, you can use the Filters button in the upper right of the page to filter your table list to a workspace, workspace tag, or project tag.
The table displays open projects. Projects set to Done/Archive will not be displayed on this page.
Print to PDF:
- You can print the chart to a PDF by clicking the kabab icon (dot dot dot) to the right of the chart title and then selecting "Print to PDF".
Top 5 column:
This column will show the Top 5 selection for only the individual setting it up. This means that each team member's Top 5 is unique and private only to their view.
- Click a radio button to select a project to be displayed in the Chart's Project Progress panel.
- You can select no more than 5 projects for the Top 5. Once you do, to replace a project with a different project, just click the radio button of the new project to add and you will get a popup asking you which existing top 5 project you want to replace. Just click that project to replace.
- The Top 5 column is sorted alphabetically with the select Top 5 at the top of the list.
- Your Top 5 is private for only your view. No other person will see your Top 5 choices.
Project column:
- Projects are listed alphabetically.
- You can jump to the project by hovering over the project name and clicking the Open Project button.
Health column:
- This is the exact same as the project status button in the Project List page.
- The project's Project Admin person can change the project status on this Table view. Click the button and change it in the popup.
- You can sort this column by clicking the "Health" column title
- The health status of a project is shared and seen across everyone else's view.
Milestones column:
- You will see the milestones progress in this column if your project is using the milestone feature.
- Sort the column by clicking the "Milestones" column title.
Issues and Risks columns:
- You will see the issues and risks numbers in this column if your project has issues or risks posts.
- The length of the bars are calculated in relative terms with all other issue and risk bars on this table page. So, if you have one project with 50 issues and another with 1 issue, the latter will have a very tiny red sliver. Hopefully you will not have projects with 50 issues! :)
- Sort the columns by clicking the their column titles.
Watch the How-To video above to see the Table in action.
ISSUE LOG
Click the ISSULE LOG tab or click the VIEW LIST button in the lower right corner of the All Issues & Risks chart to view the Issue Log page. The log page will display issues and lists from the project in the Date Modified sort order.
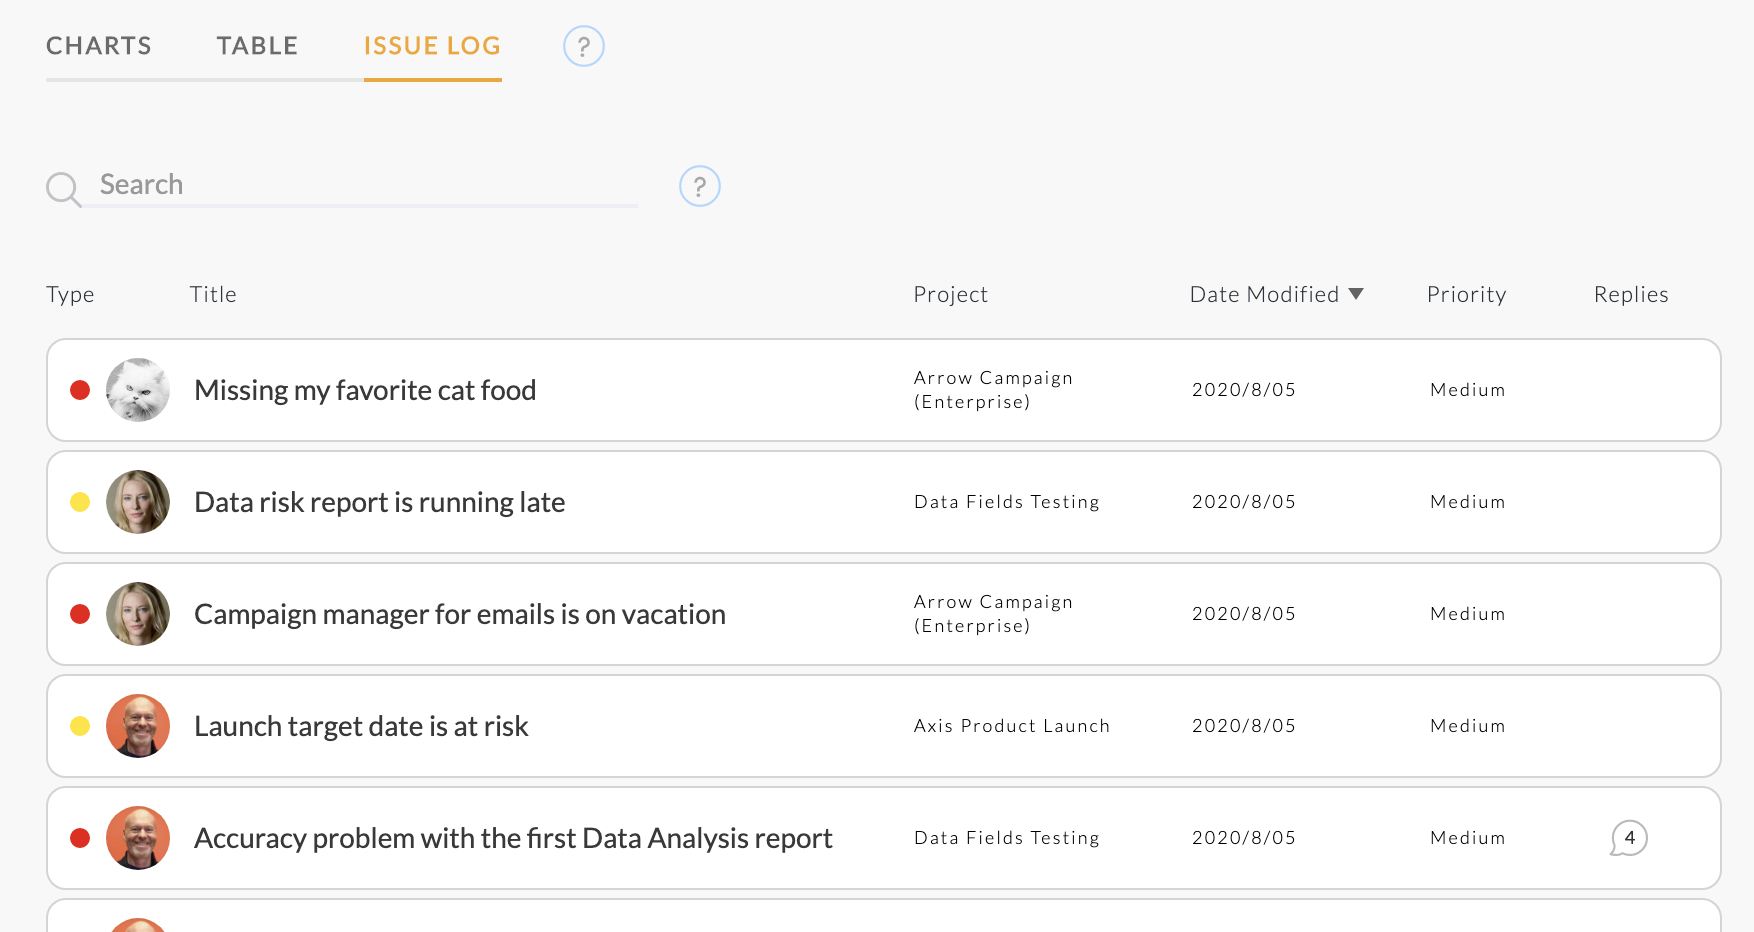
- Click to expand an issue or risk bar to read its description.
- Anyone who can see an issue or risk bar can expand it to add a reply.
- The post creator, project admin, or workspace admin are the only permissions that can edit the original post title and description (and the four fields in an issue post). These people can also delete the entire post.
- You can click any of the header columns to sort by that column A-Z or Z-A.
- The Type column's red dot is for an issue and yellow dot is for a risk.
- If there are any replies, you will see the number of replies in the Replies column. If you haven't read any of the replies yet, that icon will have a purple outline. If you own the issue or risk and someone makes a reply, the icon will be a solid purple color.
Watch the How-To video at the top of this page to see the Issue Log in action.

Comments
0 comments
Article is closed for comments.